CSWN Logo

COLORADO SEVERE WEATHER NETWORK

SKYWARN® Trained Amateur Radio Support Team
Providing Ground Truth Under The Radar

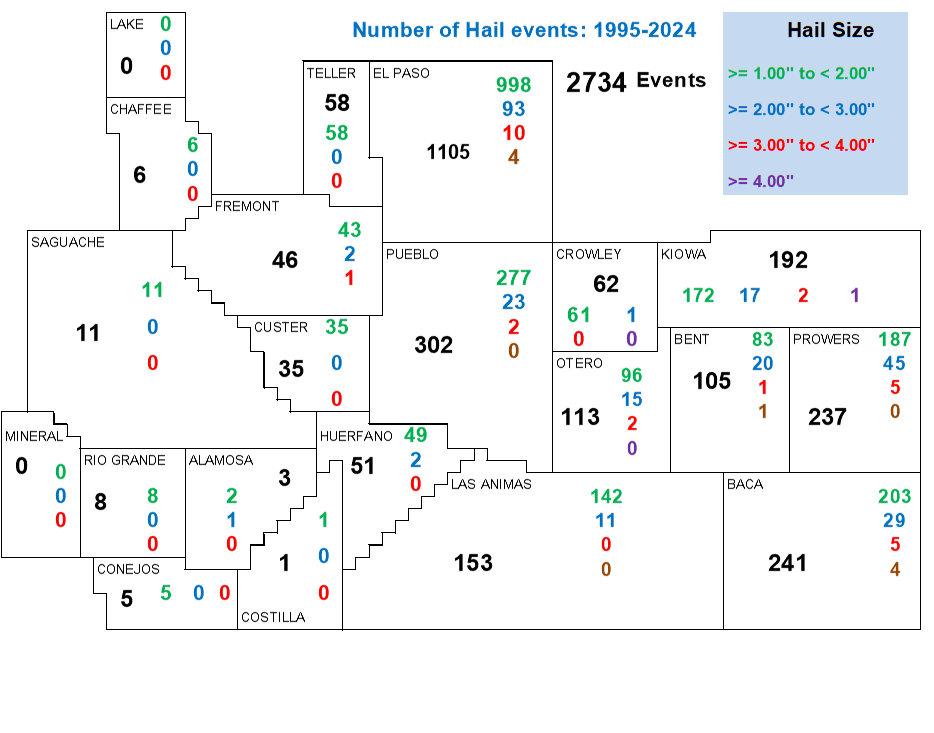
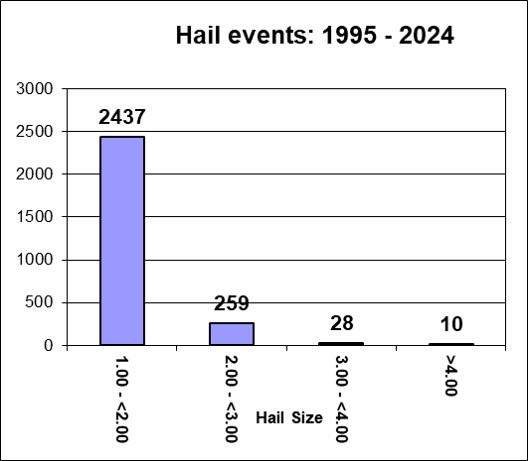
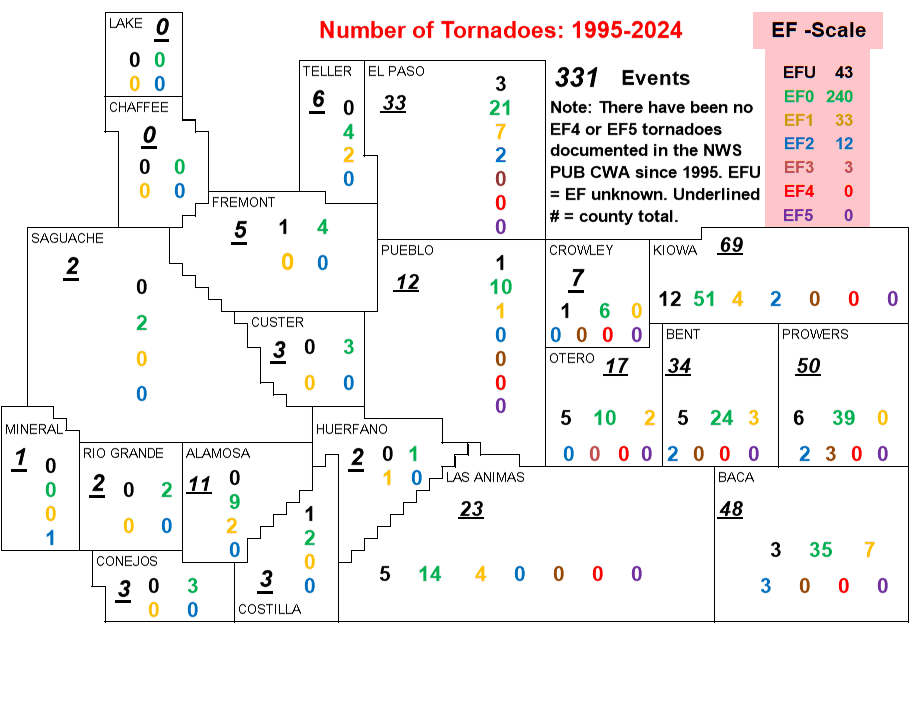
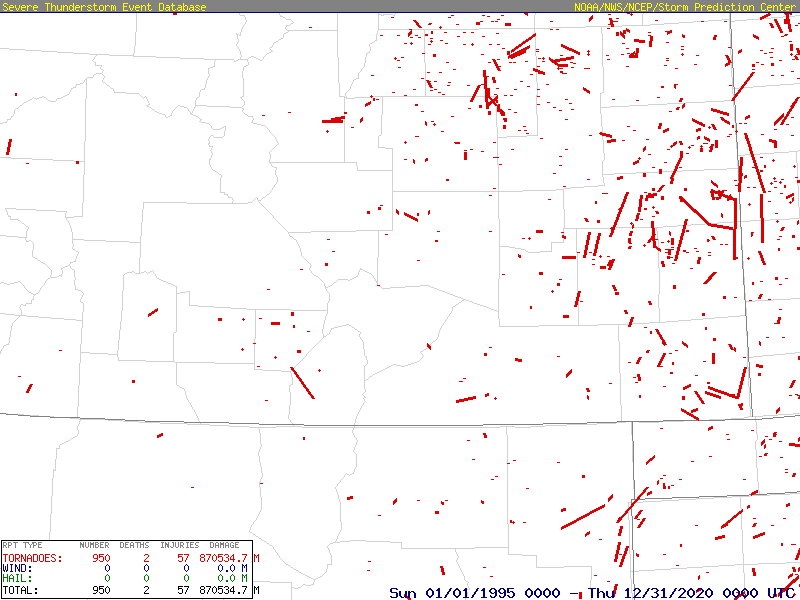
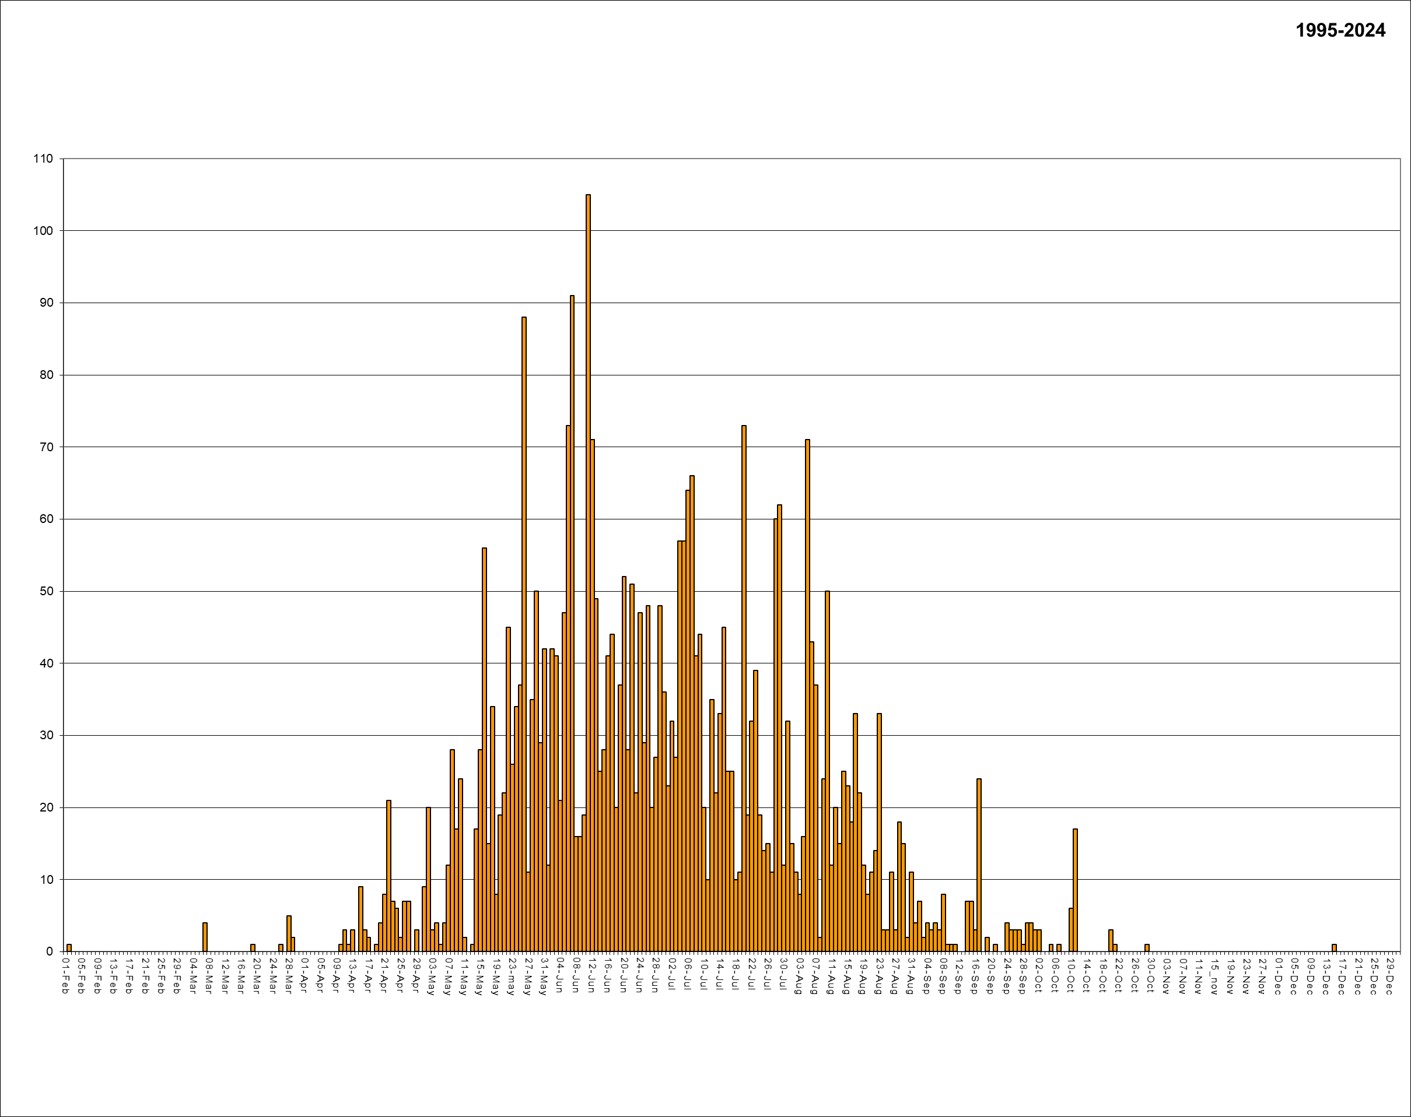
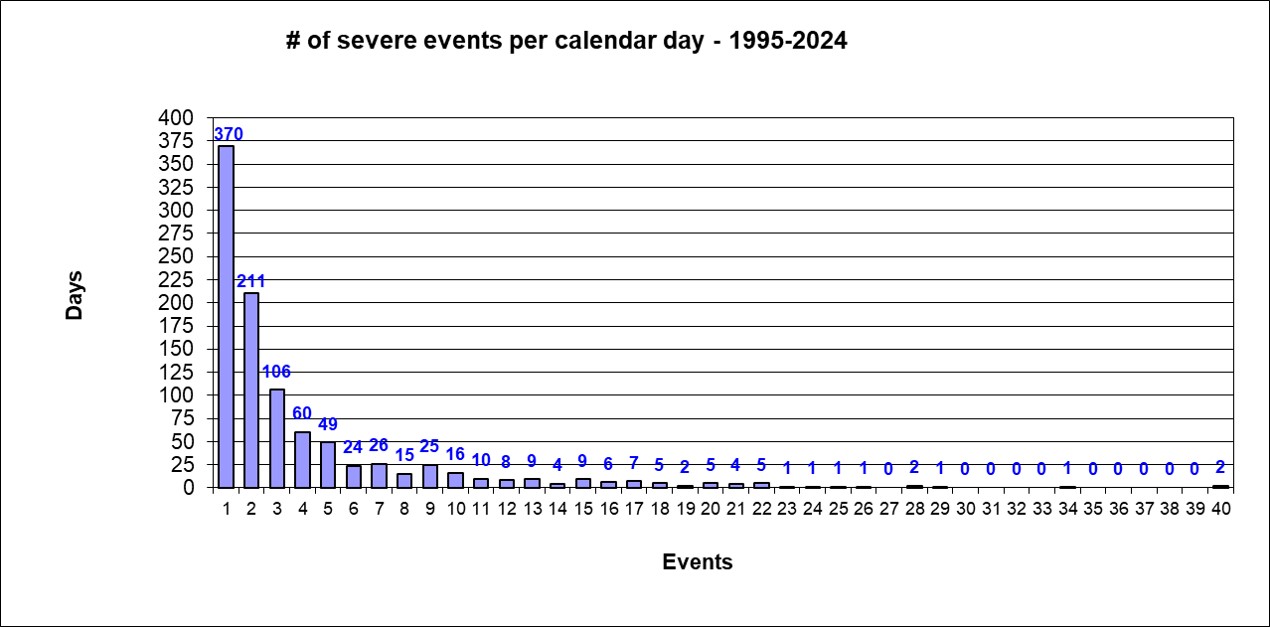
Welcome to the National Weather Service Pueblo Severe Weather climatology page. This page shows numerous severe convective weather statistics in graphical format for the National Weather Service (NWS) Pueblo (PUB) County Warning Area (CWA).

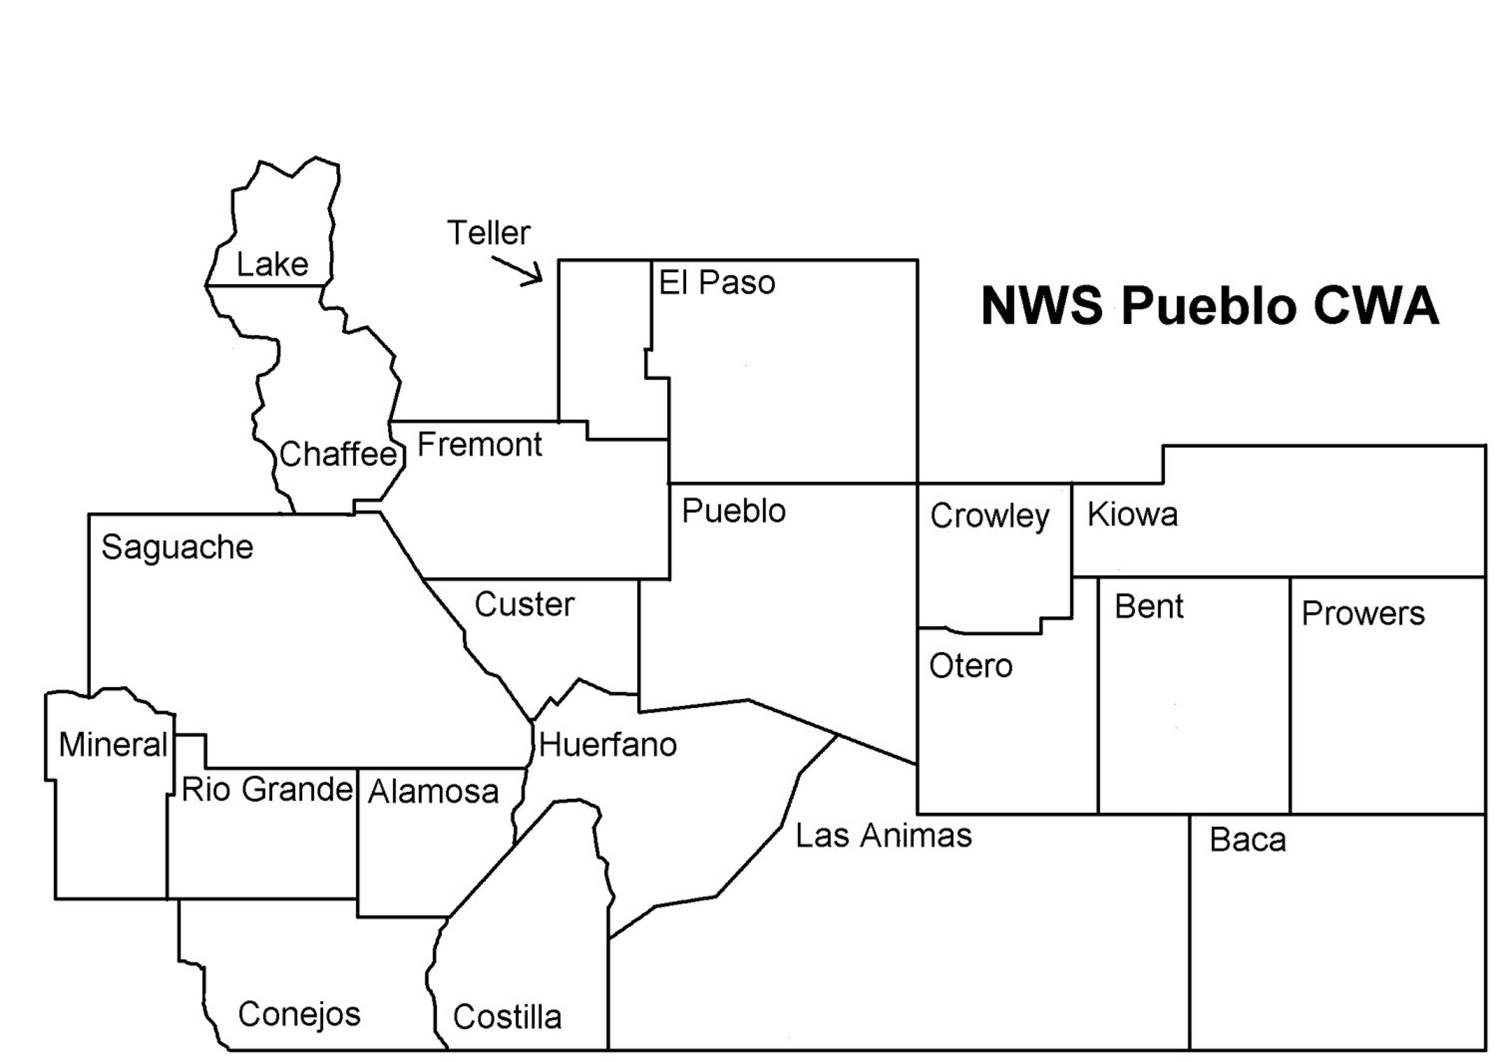
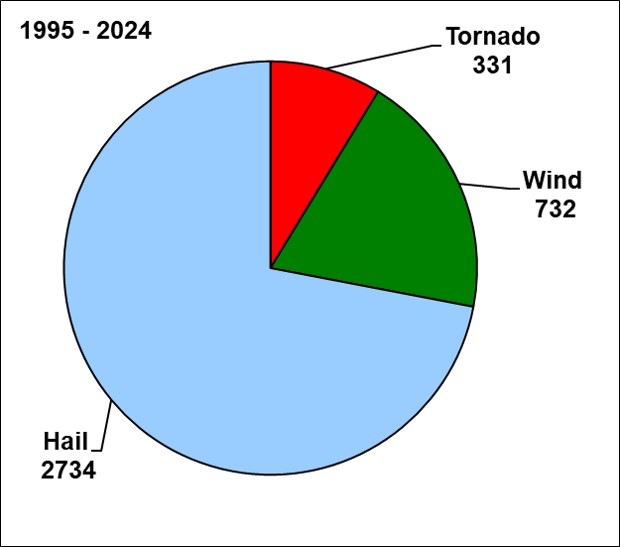
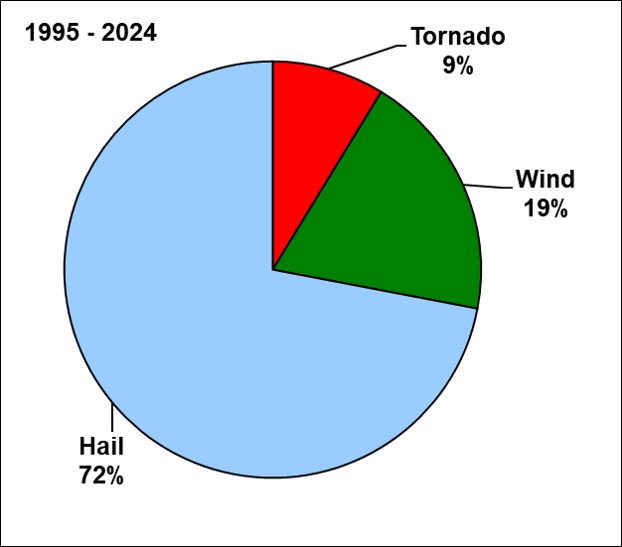
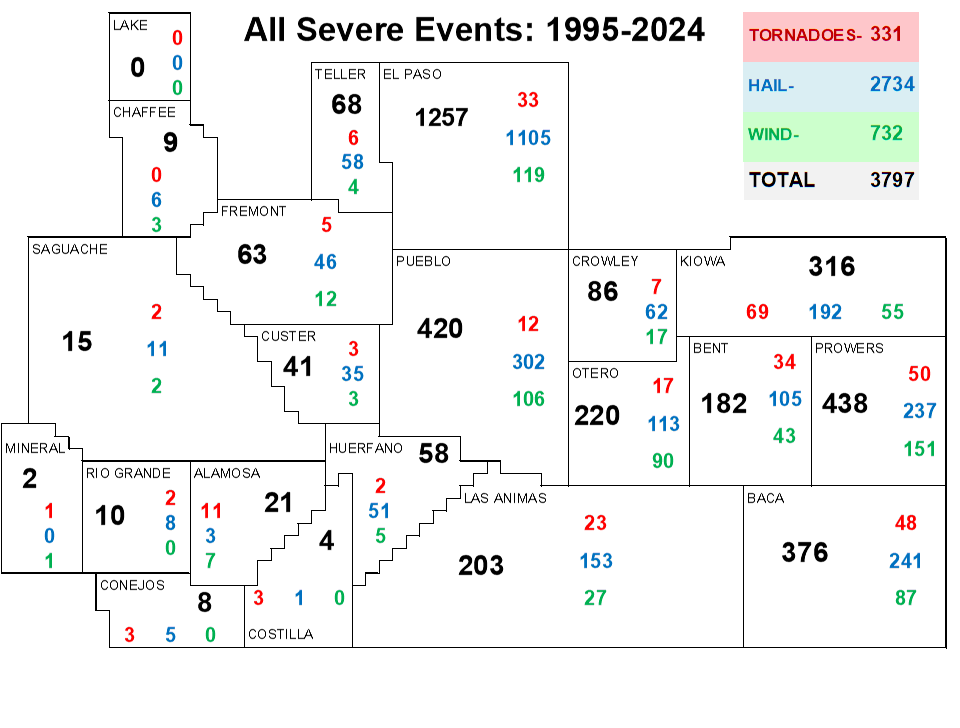
The NWS Pueblo CWA consists of southeast and south central Colorado. Data for the charts and figures in this document were created using information from the Storm Events Database maintained by the National Centers for Environmental Information. Only data from 1995 to 2024 are shown (NWS Pueblo became a forecast and warning office in 1995). This page is updated yearly, typically during the late winter months.


Map showing counties within the NWS Pueblo County Warning Area
The map above shows the counties in the NWS Pueblo County Warning Area (CWA). All severe weather statistics on this page apply only to the counties shown.


Severe weather event distribution
Distribution of the three types of severe weather events within the NWS Pueblo CWA.


Severe weather event percentages
Percentage distribution of the three types of severe weather within the NWS Pueblo CWA.


All severe weather distribution map
County-level distribution of hail (blue), tornadoes (red), and wind (green).


Severe hail size distribution map
Severe hail size distribution by county across southeast and south central Colorado.


Severe hail size distribution chart
Distribution of severe hail sizes across the NWS Pueblo CWA.


Tornado distribution map
Tornado distribution across the NWS Pueblo CWA. EFU indicates an unrated tornado due to lack of damage indicators.


SPC tornado track map
Tornado tracks across southeast and south central Colorado from 1995–2023. Additional plots are available via the Storm Prediction Center.


Tornado EF scale distribution
Tornado distribution by EF Scale. EFU denotes tornadoes that could not be rated.


Tornadoes by hour
Tornado occurrences by hour (MST) across the NWS Pueblo CWA.


Tornadoes by month
Tornado occurrences by month across the NWS Pueblo CWA.


Tornadoes by year
Tornado occurrences by year across the NWS Pueblo CWA.


Tornado events per calendar day
Number of tornado events per calendar day from 1995–2023.


Severe wind distribution map
County-level distribution of severe convective wind reports.


Severe wind report distribution
Distribution of severe wind reports across the NWS Pueblo CWA.


All severe weather by hour
All severe weather reports by hour (MST) across the NWS Pueblo CWA.


Severe weather by day of month
Severe weather events by calendar day from February 1 through December 31. No severe convective weather has been reported in January.


Severe weather events per day
Distribution of severe weather events per calendar day from 1995–2023.